If you are a parent of a teen or tween, it will come as no surprise that today's kids gravitate toward digital media.
In a 2015 study,
Common Sense Media reports that teens use an average of 9 hours of media daily, not including for school or homework. Further,
a 2015 study from the
Pew Research Center, reveals that 71% of teens use more than one social network site, including Facebook, Google+, Instagram, and Snapchat. Understandably, many parents are concerned about their children's media consumption. In schools across the country, teachers are developing curricula to inform teens about digital media and promote
digital citizenship.
In this week's Guest Blog post,
Camillus Middle School Family and Consumer Science and CTE Teacher Kelly Boswell shares an activity she created in support of digital literacy among her 6th-grade students.
In addition to learning proper "netiquette" regarding electronic communications, analyzing bias in media, and designing resumes, Kelly tasked her students with analyzing their
Digital Footprint through their use of social media. Using
Google Forms, Kelly surveyed her students to discover the types of digital applications they use. To no one's surprise,
Snapchat and
Instagram were the most popular. Students then learned that one's digital footprint is the trail or history left behind by one's interactions with the digital environment, including the use of on-demand media like
Netflix, mobile phone use, internet searches, email communication, text messages, and social media use. Kelly showed the students a short video clip related to one's digital footprint prior to tasking students to create their own model of their personal digital footprint using
Google Slides. Kelly created several templates, including the one pictured above, and used
Google Classroom to make a copy for each student. Students were then able to choose the icons and logos of the digital applications they most commonly use to apply to their model. They also linked each image to a corresponding website that provides privacy and safety information. When finished, students did a "gallery walk" as they shared one another's work on their
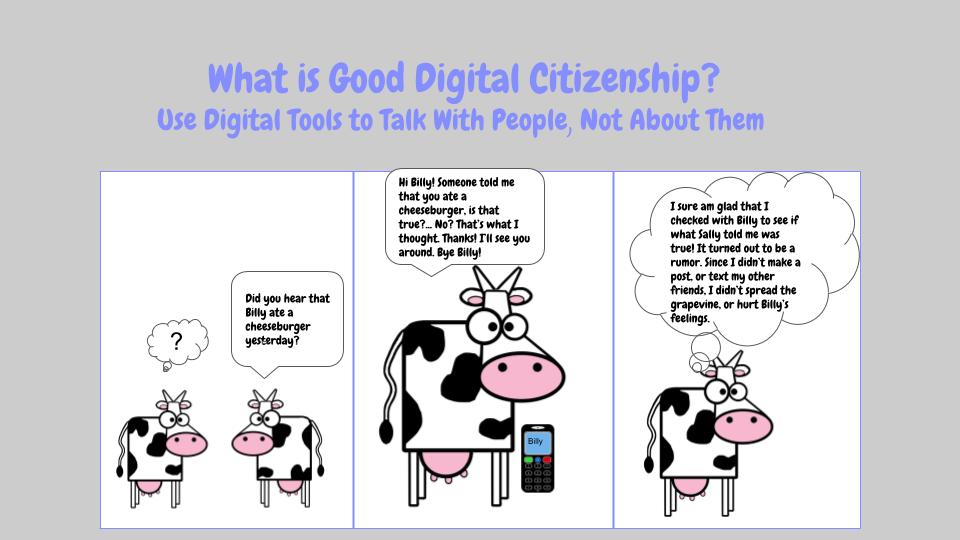
Chromebooks and recorded up to 4 safety tips from their peers. To extend the lesson, students demonstrated their understanding of the norms of appropriate, responsible technology use by creating a "digital citizenship comic strip" using a variety of tools built into Google Slides. See below for an example of a student's work.
Kelly observed that the students picked up the information very quickly and is confident that they will be able to incorporate what they have learned into their current and future classes as well as their personal lives.
 The next Superintendent's Conference day (half-day) is scheduled for March 14, 2018.